iSYSTEM introduces Sampling-based Profiling within winIDEA Software Analyzer
Statistically analyze CPU utilization, OS task and ISR load distribution and monitor data signals over time via a debug port.
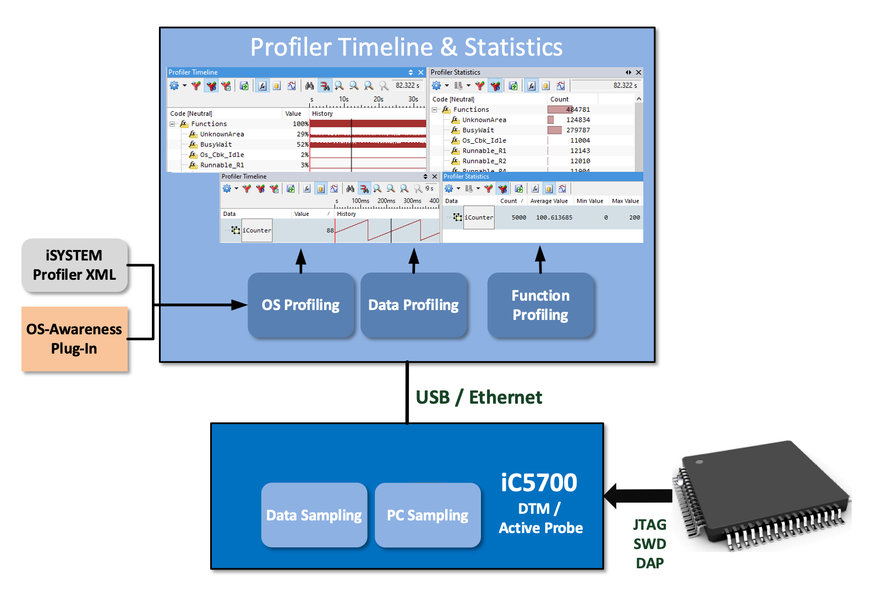
The concept of Sampling-based Profiling in winIDEA.
iSYSTEM introduces a new feature of their IDE, debug and software analyzer tool winIDEA: The Sampling-based Profiling allows developers to carry out timing analysis via the debug interface of microcontrollers and processors with limited trace options or hardware trace resources. Via Program Counter (PC) and Data Sampling, developers can statistically measure and monitor CPU utilization, load distribution and data signals over time to test their application. The new feature is simple to use with any kind of microcontroller or processor and streamlines software development and test especially for safety applications in various markets like automotive, healthcare, and industrial automation.
Sampling-based Profiling is part of the winIDEA Software Analyzer. With this function, the developer obtains data by sampling specific memory locations or the CPU Program Counter via the debug interface – without the need for any trace hardware. The profiler also analyzes the retrieved data and visualizes the results.
iSYSTEM has implemented support for two main use cases: PC Sampling and Data Sampling. The iSYSTEM Profiler samples data on program execution and calculates the CPU Utilization in percent for each function to calculate the function load. OS Running Task and ISR Load Profiling gives insights to OS Task and ISR Load distribution. In both cases, the developer will run samples until the statistics stabilize. This provides a very good indication about the load situation in the system and helps the developer to judge if the application is running as expected or not. The third option of Sampling-based Profiling – which is not really related to Timing Analysis and less practical – is to build a kind of an oscilloscope for monitoring data signals over time.
Sampling-based Profiling does not replace real hardware trace as it cannot guarantee that all relevant events are captured. However, it is the perfect tool for statistical analysis or for sampling slowly changing variables in a system and helps developers to further streamline their testing effort.
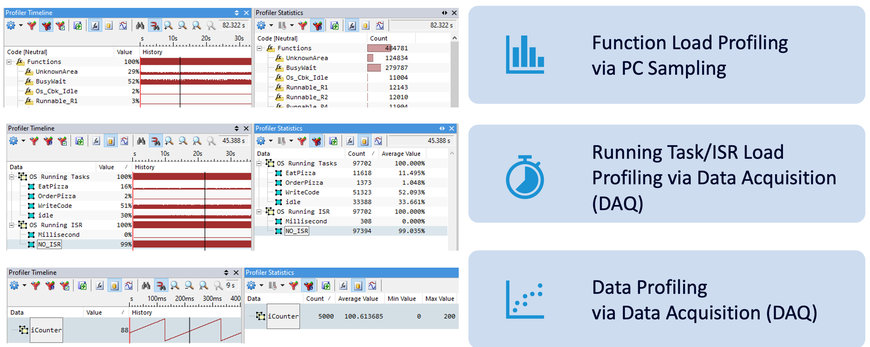
The three use cases of sampling-based profiling.
“Some of us call it ‘Poor Man’s Profiler’, but nevertheless, Sampling-based Profiling is an extremely helpful statistical analysis method based on sampling, and a valuable extension of the iSYSTEM Software Analyzer,” says Erol Simsek, CEO of iSYSTEM. “Even if the processor has no trace interface for pure timing and load analysis, this new feature enables our customers to quickly get an idea of the run-time behavior of their software.”
In a live webinar on September 23, 2021, iSYSTEM gives a comprehensive introduction to Sampling-based Profiling within the iSYSTEM Software Analyzer. The registration for the webinar has already opened at https://www.isystem.com/support/meet-us/cpu-load-measurement.html.
Further Links and Resources
- PC Sampling and Data Sampling: Profiler Sampling with iSYSTEM winIDEA
- Webinar (YouTube): Timing Analysis using the iSYSTEM Profiler
- Application Notes: Profiling
- Tutorial Start Tracing with iSYSTEM Tools